Decoding Cost Components: A Deep Dive into European Trucking Expenses
Diesel represents 25% of transportation costs, or is there more to consider?
A Total Cost of Ownership (TCO) model is a financial estimate that helps to understand the direct and indirect costs associated with the purchase, deployment, use, and maintenance of a product or system over its entire lifecycle.
At Transporeon, we developed a cost model that accomplishes this through a structured approach. Naturally, all begins with a thorough research on cost elements, tracked quarterly, ensuring the data´s timeliness and relevance. The numerous countries in Europe add an additional layer of complexity as values need to be researched on a country level and availability of information is not uniform. So even for a plain domestic transport, required cost information might come from various countries due to the freedom of movement in European transportation.
For more information about our cost model please refer to the following post:
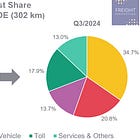
In this post, we aim to highlight an aspect often overlooked in usual averages: the volatility or variance of values depending on market segments, time, or geographic region. Depending on the use-case of these cost shares (e.g. for a diesel floater or rate adjustments and negotiations) it is relevant to understand their variations. We cover more than 200 country combinations in Europe, providing a comprehensive understanding of how values can vary. Over the past five years, calculating the median of different countries, segments, and quarters reveals expected results: driver wages are the most significant cost factor, followed by fuel (around the famous 25%) and tolls, including ferry fees.
Share of cost components for FTL trucking during 2020 - 2024
Source: Transporeon Market Insights
So, diesel at 26% all confirmed? Or is there more to consider?
The critical question is: Are these values volatile, or do they remain relatively stable? Our initial analysis focused on the median of the basket of these 200+ countries to assess volatility over the last few years, without delving into specific market segments or country combinations. The following graphic illustrates the ranges of different cost clusters from 2020 to 2024.


