

Real-life insights into crossing Swiss borders
Market Monday - Week 11 - Mountainous island of border friction in the heart of Europe

Switzerland is a beautiful country in the center of Europe, and it is one of the most important transit hubs for European road freight, serving as the anchor for the North-South transalpine corridor. Despite the country’s famously high heavy vehicle tolls and notorious border delays, road transport sometimes remains the preferred choice over rail or intermodal modes due to its site-to-site flexibility, faster transit times for just-in-time supply chains, and the ability to bypass rigid rail schedules and intermodal terminal capacity limits.
However, planning and moving goods across Swiss road borders requires some degree of understanding of network dynamics. Following a period of relative relief in 2024, recent data indicates that border crossing delays are rebounding to high levels again. Using exclusive data from Transporeon’s Real-Time Visibility products, we analyzed millions of tracking events to uncover exactly what shippers and carriers are experiencing.
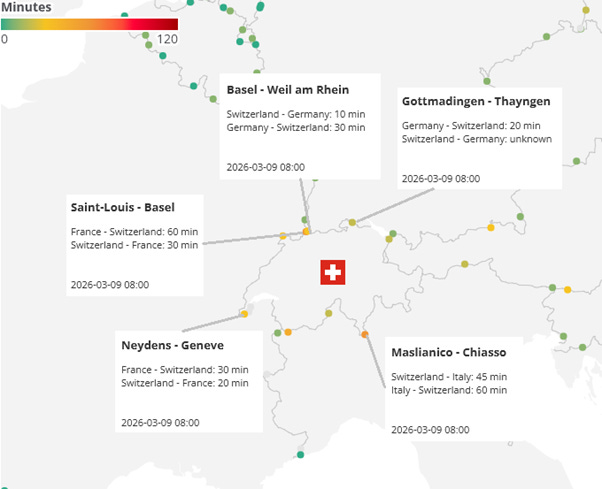
While Switzerland has numerous large and small border crossings, commercial freight traffic is heavily concentrated at a few. For this analysis, we isolated the five busiest commercial road gateways based on historical heavy goods vehicle volumes. These crossings handle the lion’s share of transit and import/export goods movement:
Saint-Louis - Basel (France/CH): The heavy commercial node for Western inbound traffic.
Weil am Rhein - Basel (Germany/CH): The undisputed primary artery for the North-South corridor coming from Germany.
Gottmadingen - Thayngen (Germany/CH): Another vital gateway to Germany.
Maslianico - Chiasso (Italy/CH): The primary southern anchor feeding the Gotthard route.
Neydens - Geneve (France/CH): The high-volume artery for southwestern Switzerland and France.
A note on methodology: Calculating border delays in logistics can be misleading if simple 24-hour averages are used, as empty nighttime borders and closed truck crossings might mathematically pull down the overall figures. To provide a true reflection of driver experience, the data from Transporeon Real-Time Visibility was strictly filtered to include only active business hours (06:00 to 20:00) from Monday through Friday. Nighttime and weekend crossings were excluded. By isolating these specific parameters and focusing on the five highest-volume commercial gateways, we gain a much clearer observational lens into the structural realities of the Swiss freight network.
The immediate observation from the Real-Time Visibility data is the severe directional imbalance. Simply put, traffic flowing into Switzerland waits significantly longer than traffic flowing out.
This discrepancy is rooted in the structural differences between import and export procedures. Inbound freight faces rigorous import checks, temporary payment of customs duties and VAT, and the physical processing of transport declarations if they were not submitted in advance via digitized systems. Conversely, exiting the country is a much lower-friction process. In 2025, inbound wait times average 42 minutes, while outbound freight wait times average 25 minutes.
When analyzing average waiting times over a three-year horizon (2023–2025, see chart below), a V-shaped trend emerges. In early 2024, the network experienced a notable easing of congestion. Average waiting times to enter Switzerland dropped significantly across all border points, an improvement likely driven by Switzerland’s abolition of industrial import tariffs on January 1, 2024, and the scaled rollout of digitized customs systems, which enabled smoother administrative clearances.
However, this administrative relief was soon outpaced by the return of physical volumes. As we moved deeper into 2025, average waiting times were steadily climbing back to the higher levels seen in 2023. Today, the network average has crept back up to roughly 34 minutes, and peak season autumn figures are pushing beyond that.
For a more tactical and tactile understanding of how these bottlenecks behave, it is essential to know how delays fluctuate throughout the standard working week.
Looking at the weekday percentiles, we find the weekly transport trends:
Inbound traffic is more congested on Basel crossings on Mondays. At the Saint-Louis – Basel border point 10% of trucks are waiting for two hours or more on Monday. This is a classic symptom of the weekend heavy vehicle driving ban clearing out, creating a massive Monday morning freight backlog waiting to enter the country.
While Mondays are highly volatile for Basel, other borders see their congestion peak mid-week. Gottmadingen - Thayngen and Neydens - Geneve see their averages and 75th percentile buffers peak on Tuesdays and Wednesdays, reflecting the natural flow of transit freight reaching the borders a day or two after dispatch from deeper within Europe.
Across almost all crossings, Fridays offer the lowest average wait times and the smallest 75th/90th percentile buffers. This points to a decline in volumes as dispatchers try to avoid having drivers caught in weekend bans.
The 90th percentile data demonstrates why “averages” alone are insufficient for supply chain observation. Even when the average wait at Gottmadingen - Thayngen (DE->CH) looks better on Monday than on Tuesday or Wednesday, the 90th percentile shows that planning for a 120-minute buffer is often required at the week’s start, highlighting a high degree of unpredictability there.
Oleksandr Kulish
Senior Consultant