

Rising Toll: Impact of Legislative Changes on Transport Costs
Market Monday - Week 44 - Cost components development on a exemplary corridor

In this week's article, we will delve into cost monitoring and identify which cost components have driven increases over the past years. Surprisingly, one component stands out significantly on this exemplary corridor from Belgium to Denmark.
Cost monitoring, particularly through models like our Total Cost of Ownership (TCO), is essential as it provides a comprehensive view of all costs associated with transport operations, including driver wages, tolls, diesel, equipment costs, and maintenance. This holistic analysis aids in informed decision-making, allowing companies to make strategic decisions about pricing, budgeting, and investments to remain competitive and profitable. Regular cost monitoring also helps to identify areas for efficiency improvements and cost reductions, such as optimizing routes or reducing empty mileage.
Understanding the total cost structure through TCO models enables better strategic planning and forecasting, preparing companies for future market changes and economic conditions. To demonstrate the strengths of such a tool, I’ve selected one international corridor influenced by numerous legislative changes in the recent past: Antwerp (BE) to Odense (DK).
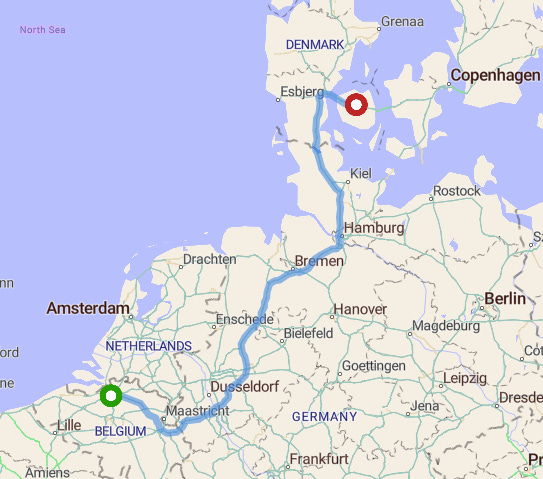
Source: Trimble Maps
This corridor, from Belgium to Denmark, is influenced by the Mobility Package ruling, periodic or singular toll adjustments, changes in toll systems, diesel price surges, and driver shortages, just to name the most prominent factors over the last five years. But how have these components changed the underlying production costs for asset-based carriers on this route? The following table provides a brief overview of the changes in our five cost clusters.
Cost development Antwerp to Odense
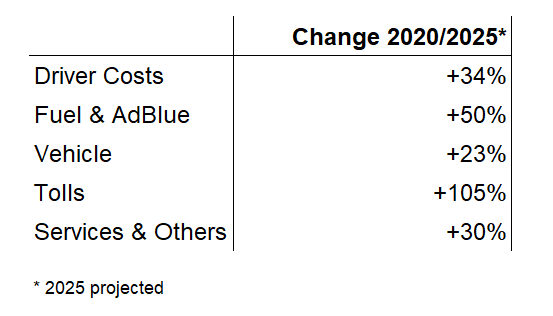
Source: Transporeon TCO Model in Market Insights
Interestingly, despite the prominent topics like driver wage and fuel increase, toll represents the largest portion of cost increases until Q1 of 2025. With Denmark switching to a distance-based toll system in 2025, overall toll costs will have doubled within five years.
Given this evolution, a shift in cost shares is the logical consequence. Starting from 13.6% in 2020, toll costs are expected to reach a total cost share of 19.1% in 2025, surpassing vehicle costs to become the third-largest cost component.
Cost shares Antwerp to Odense
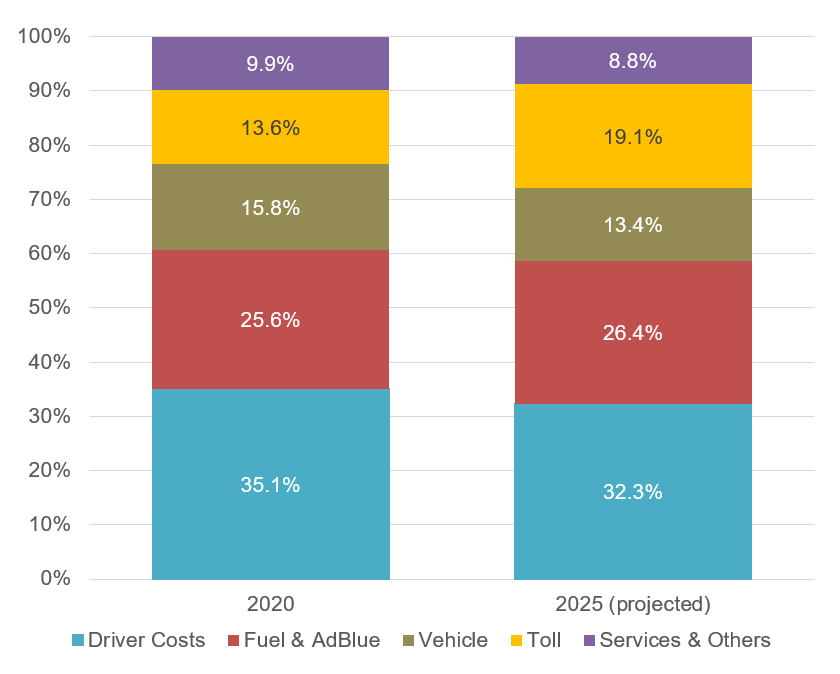
Source: Transporeon TCO Model in Market Insights
Although driver wages are often seen as one of the most significant contributors to cost and price increases, this analysis reveals that tolls and fuel have outpaced other components, consequently gaining a larger share. Particularly tolls, as a measure of governmental intervention, showcase the intention of legislative bodies to reflect the true costs of transportation incl. their external effects. Needless to say that the resulting increase in financial possibilities creates a bonus for governments.
We haven’t reached the end of toll adjustments, more changes will follow, likely sooner than later.
Stay tuned for a follow up article on the TCO topic, with focus on the volatility of cost components and their significance for a forward-looking perspective.
Christian Dolderer
Lead Research Analyst
Transporeon